The first 3D structure of photosystem II (PSII) supercomplex of higher plants (eukaryotes) was constructed by single particle analysis of images obtained by electron cryo-microscopy in 2000.
This large multisubunit membrane protein complex functions to absorb light energy and catalyse the oxidation of water and reduction of plastoquinone. The resolution of the 3D structure is 24 Å and emphasises the dimeric nature of the supercomplex. The extrinsic proteins of the oxygen-evolving complex (OEC) are readily observed as a tetrameric cluster bound to the lumenal surface.
By considering higher resolution data, obtained from electron crystallography, it was possible to relate the binding sites of the OEC proteins with the underlying intrinsic membrane subunits of the photochemical PSII reaction centre core.
This 3D model represented a significant step forward in revealing the structure of the photosynthetic OEC, whose activity is required to sustain the aerobic atmosphere on our planet.

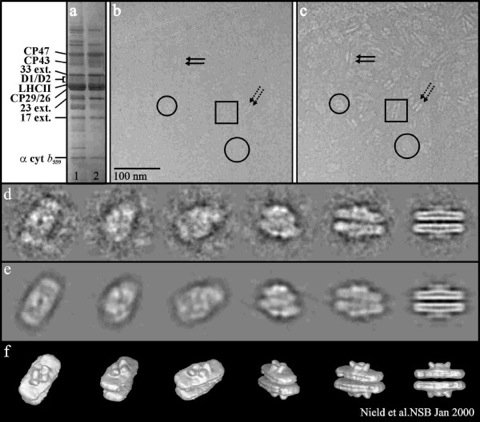
Fig. 1. Protein composition, electron micrographs and 3D analysis of the PSII supercomplex.
a, SDS-PAGE of the PSII-enriched membranes (track 1) and PSII supercomplex (track 2), stained with Coomassie R250. b and c are cryoelectron micrographs of a typical preparation of the PSII supercomplex showing particles randomly orientated in vitreous ice, under focused at 1.35 mm and 7.2 mm, respectively.
d, Selection of typical class averages used for the 3D reconstruction.
e, Reprojections of the 3D map in identical orientations with the corresponding class averages.
f, Surface representation of the final 3D map viewed in the same orientation as the class averages.

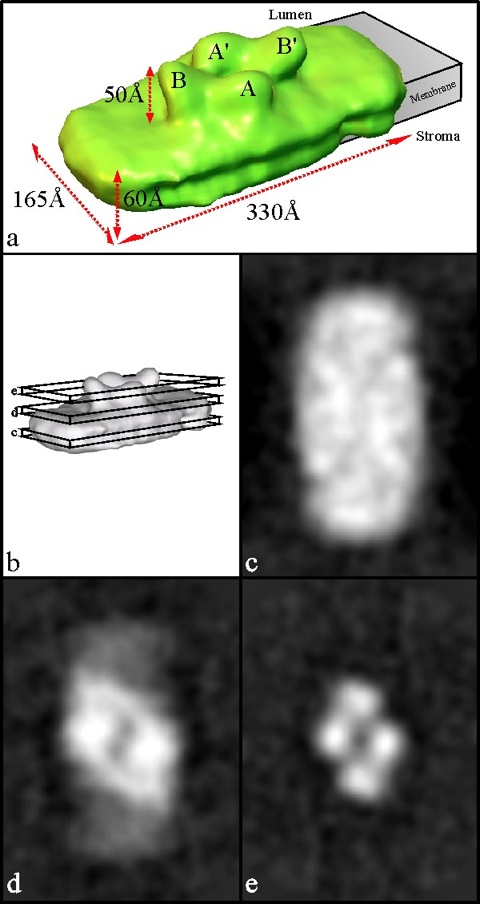
Fig. 2. 3D map of the PSII supercomplex at 24 Å and sections 10 Å thick through the map.
a, Half the 3D map, corresponding to a single dimeric supercomplex, is viewed from an oblique angle to visualise the lumenal surface and the extrinsic OEC proteins labelled A/A` (assigned to 33 kDa OEC protein) and B/B` (assigned to 23 kDa and 17 kDa OEC proteins). The putative location of the membrane-spanning region is indicated. Also shown are the overall dimensions, including the maximum extent of the protrusions corresponding to the OEC extrinsic proteins.
b, Surface representation of the 3D map indicating 10 Å thick sections taken as follows:
c, Projection map of the transmembrane region towards the stromal surface.
d, Projection map of the region close to the lumenal surface.
e, Projection map of the region occupied by the OEC extrinsic proteins.

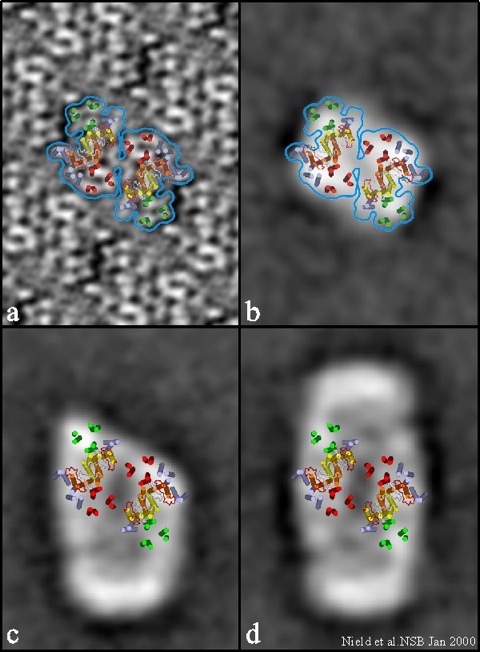
Fig. 3. Positioning of major transmembrane helices of the central dimeric core region within the PSII supercomplex.
a, Projection map obtained from 2D crystals of the PSII core dimer complex at 9 Å showing proposed positions of its transmembrane helices taken from Hankamer et al.(13) The model for the D1 and D2 proteins shown in yellow and orange, respectively, was constructed using the coordinates for the L and M subunits of R. viridis (17) as justified by a recent 8 Å 3D structure of the PSII CP47 RC complex (15). The 6 red helices in each monomer correspond to those of CP47 and the corresponding 2 fold related 6 green helices are those of CP43. The additional 7 transmembrane helices colored in purple were identified in Rhee et al.(15) and are unknown low molecular weight proteins.
b, Superimposition of the transmembrane helices determined by electron crystallography (13,15) onto a projection from the 3D reconstruction of the core complex from a subpopulation of 1,100 particles identified by cryoelectron microscopy (estimated resolution 32 Å).
c, Superimposition of the transmembrane helices in a and b onto a projection map obtained from the 3D reconstruction (estimated resolution 28 Å) calculated from 3,700 particles of a subpopulation of supercomplexes that have lost one LHCII-containing peripheral region, thus exposing one edge of the central core dimer (also see ref. 7).
d, Position of the core dimer transmembrane helices in the central region of the projection map from the 3D reconstruction of the intact supercomplex (estimated resolution 24 Å) based on a, b and c. Projections b, c and d do not include the extrinsic proteins.

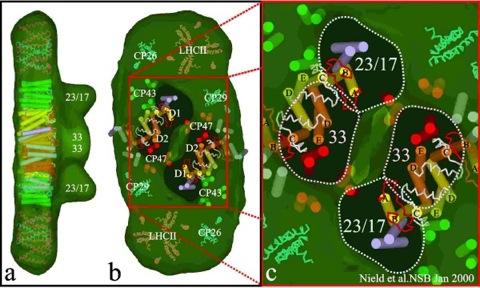
Fig. 4. Structural model of the intrinsic protein subunits within the PSII supercomplex.
a, b, Shows a semi-transparent surface representation of the structural model, viewed from the side and lumenal surface respectively, containing helices of the protein subunits based on detailed comparison of high and intermediate resolution structures. The positions of the transmembrane helices of the core dimer are based on Fig. 3 and the same colour code has been used. The LHCII, CP24 and CP26 are derived from Kühlbrandt et al.(16) and have been positioned based on internal density distribution in the supercomplex and on cross-linking data (31,32). The region flanking the central core may also contain the PsbS protein (2) but no attempt has been made to model this four transmembrane helical protein into the map. The interface between the extrinsic OEC proteins and the lumenal surface has been assumed to be at the lumenal side of slice d in Fig. 2b and this is shown as 'windows' looking into the intrinsic interior of the supercomplex.
c, A magnification of the docking sites for the extrinsic OEC proteins emphasising the underlying helices of the core dimer. The helices attributed to the D1 and D2 proteins (yellow and orange, respectively), are modelled using the coordinates of the L and M subunits of R. viridis as are the CD (in white) and AB (in red) lumenal loops.
For this work we thanked Holger Stark for assisting with the electron cryo-microscopy. We also acknowledged Michael Schatz and Ralf Schmidt for their input through Imagic Science, GmbH, Berlin. We particularly thanked Ben Hankamer for valuable discussions. Financial support for the work was from the BBSRC.
© Nature Structural Biology, 2000. All rights reserved. doi. 10.1038/71242.